Another example of an AVNRT ablation using the voltage/propagation technique
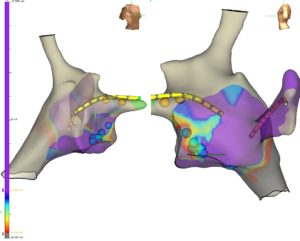
- LAT map showing the late activation low in the TK near the tricuspid valve. The white and red represent the early activation. The blue then purple shows the latest sites of activation at the bottom of the TK the Tricuspid Valve.
2. The same map, using propagation wave mapping. Notice the propagation wave collision and the LAT map show late activation sites. This site is unusually low in comparison to most patients. Mark this area for reference on the Voltage map. The marked late activation/wave collision can be seen in the following image below.
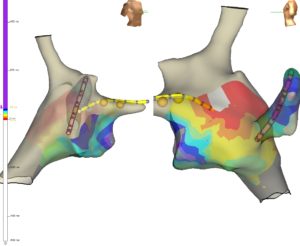
3. Evaluate the voltage map for low voltage areas. Notice the previously marked line signifying the late activation at the propagation wave collision.
4. Sparkle mapping can also be used as an alternative to visualize late activation and wave collisions. This is similar to the ripple map on Carto.
5. Choose the ablation location just superior to the late activation/wave collision, at a site of low voltage. If using cryotherapy, consider ablation during AVNRT. This ablation was attempting to ablate on the edge of the low voltage area, just superior to the late activation/wave collision (marked by the dark line). The arrhythmia terminated at 8s after initiation of cryotherapy so received a 5 min application. There was no longer any SVT. This area was solidified with additional 4 min cryo applications.
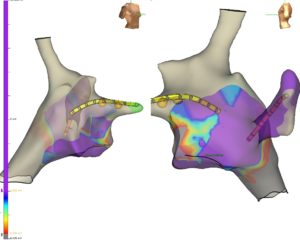
6. The final map. After the initial lesions there remained single echo beats so additional applications were placed (blue spheres). The most superior lesion resulted in complete elimination of the slow pathway, now with no jump, echo or inducible AVNRT.